Documentation

Montgomery Core user guide

Montgomery Core brings map exploration, local scoring, opportunity detection, location comparison, saturation analysis and business calculators into one decision workspace. This guide explains what each tool does and how to read its results.

Main tools

Each module answers a specific business question: where to look, how strong a location is, whether an area is saturated, how two addresses compare, and which commercial assumptions to use once a site has been shortlisted.

Interactive map screenshot
Tool 01

Interactive map

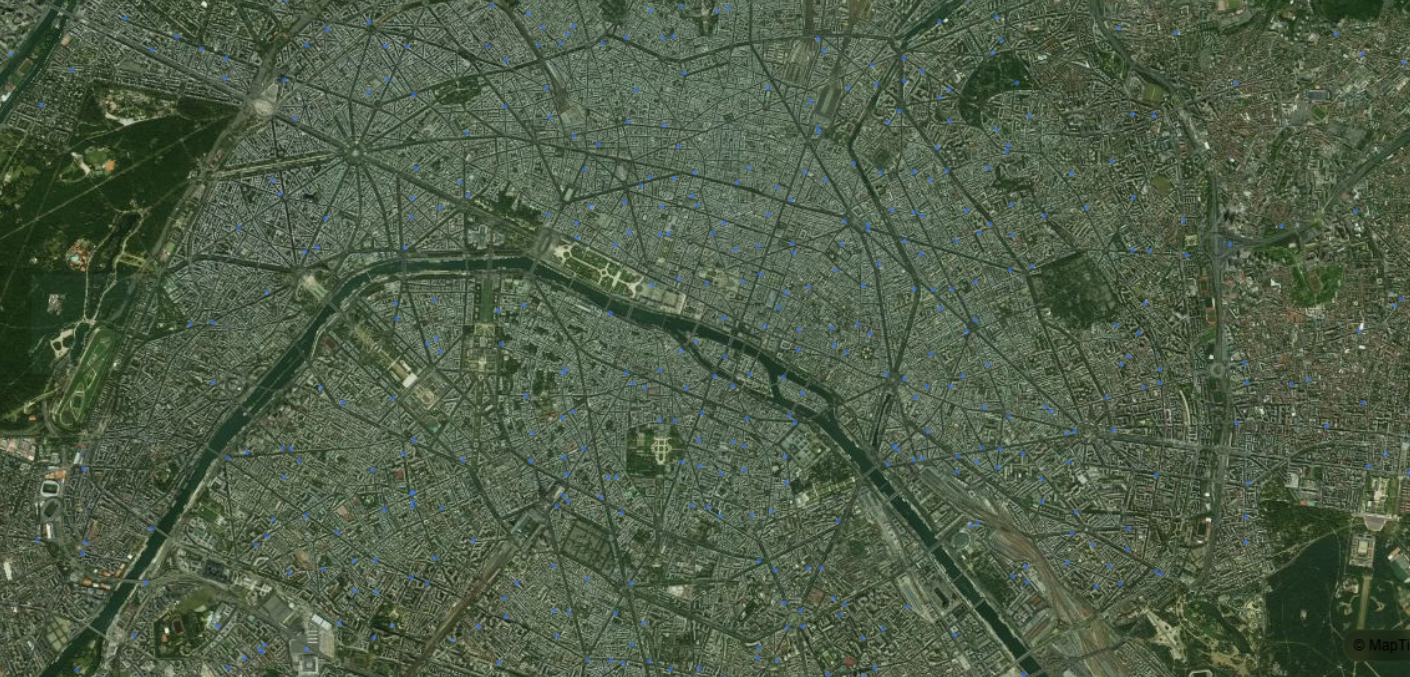
The interactive map is the entry point for field exploration. It displays local businesses, public infrastructure and optional IRIS layers so you can analyze a city's commercial context before launching deeper analyses.
Use it to search places, filter by activity, switch demographic layers, open a point in potential analysis or select two locations to compare.
Potential analysis screenshot
Tool 02

Potential analysis

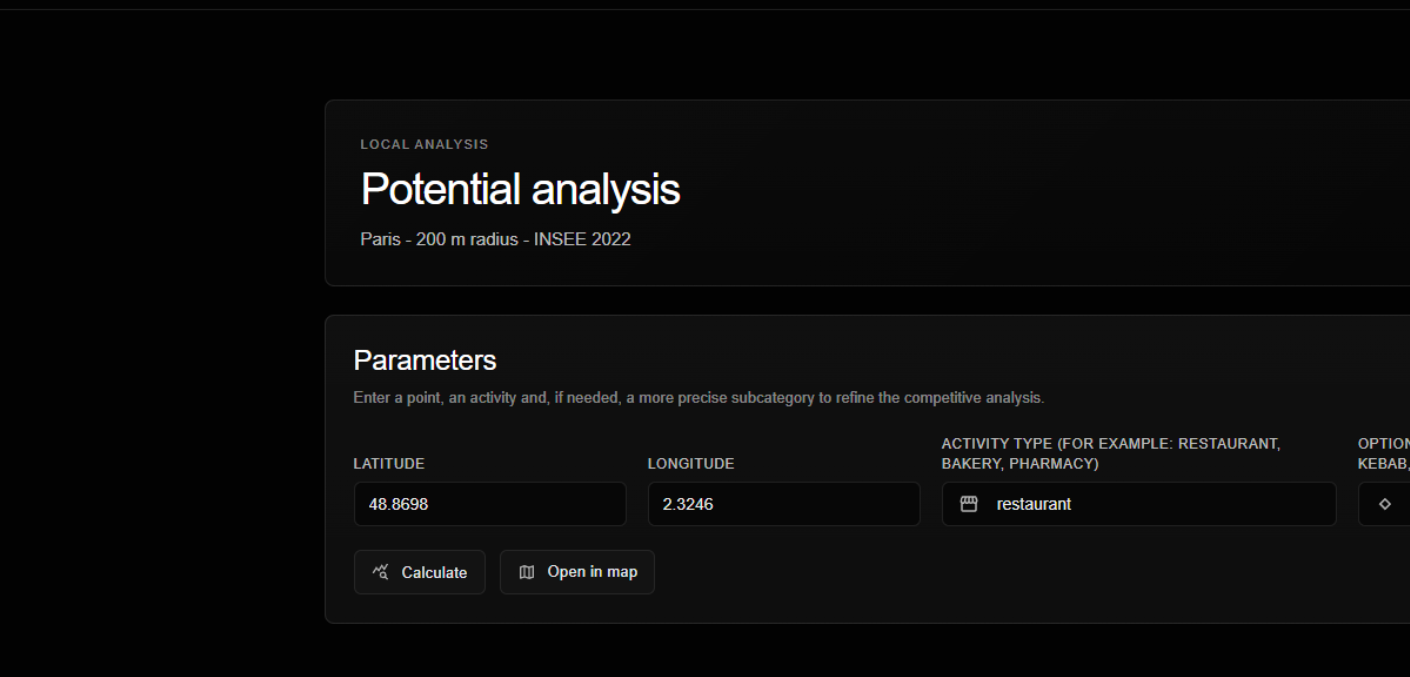
Potential analysis evaluates a precise location for a selected activity. It combines local demand, target fit, purchasing power, human traffic, competition, socio-economic risk and contextual signals into a structured score.

Enter latitude, longitude, activity and, if useful, a subcategory to evaluate a point, export the analysis or save a report.
Area saturation analysis screenshot
Tool 03

Area saturation analysis

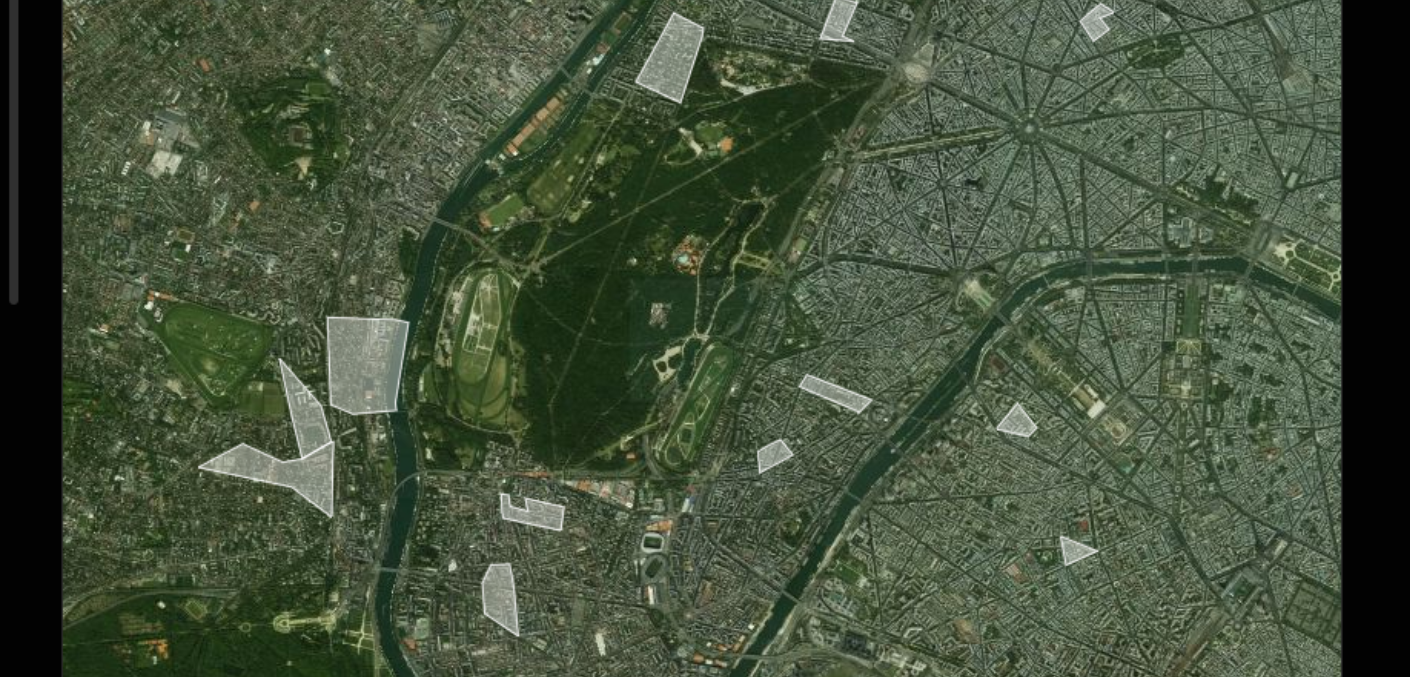
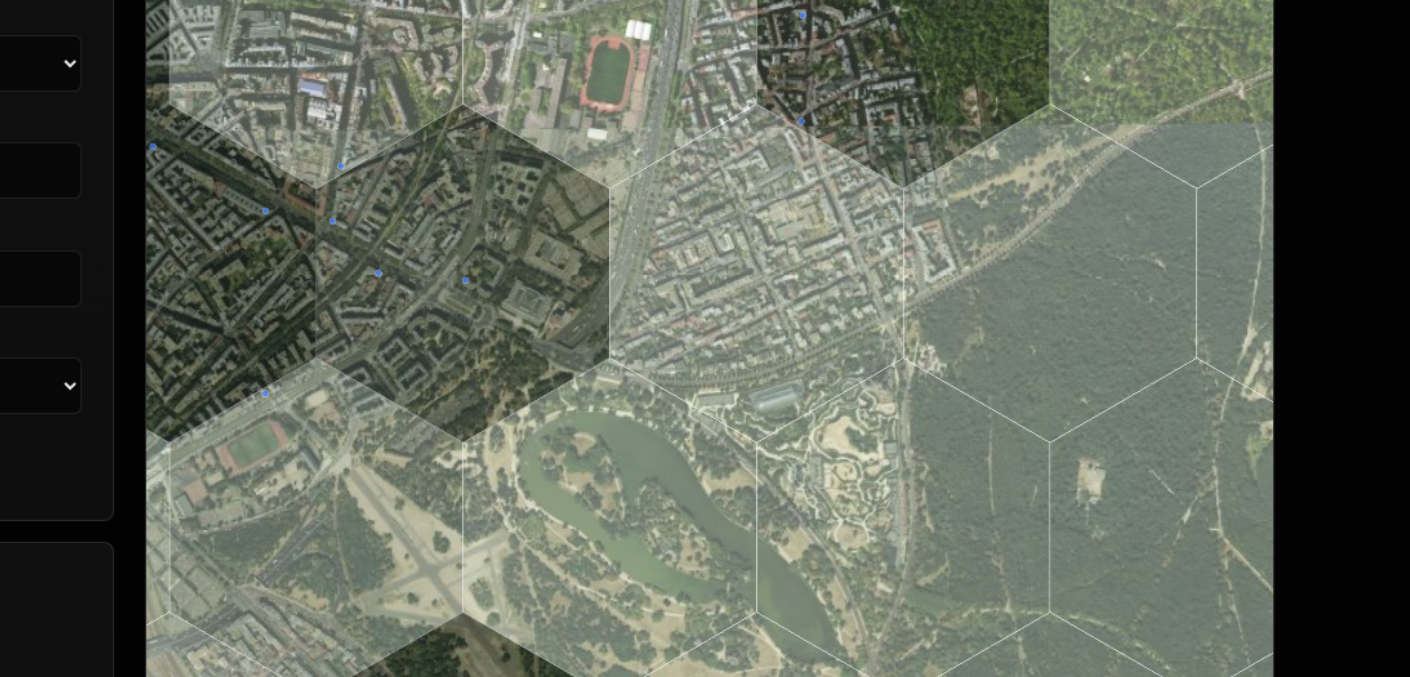
Area saturation analysis shows where an activity is concentrated or underrepresented. The hexagonal grid makes sector comparison easier and helps identify underserved, balanced or highly saturated zones.

Use it to scan a city by activity, refine the reading with a subcategory and understand competitive density before choosing candidate locations.
Opportunity search screenshot
Tool 04

Opportunity search

Opportunity search starts from a business profile rather than a single address. You define the target activity, audience, density, income context, competition tolerance and selection mode, then Montgomery Core highlights compatible areas.

Use it when you know what type of location you are looking for, but have not yet chosen the street or exact address to analyze.
Location comparison screenshot
Tool 05

Location comparison

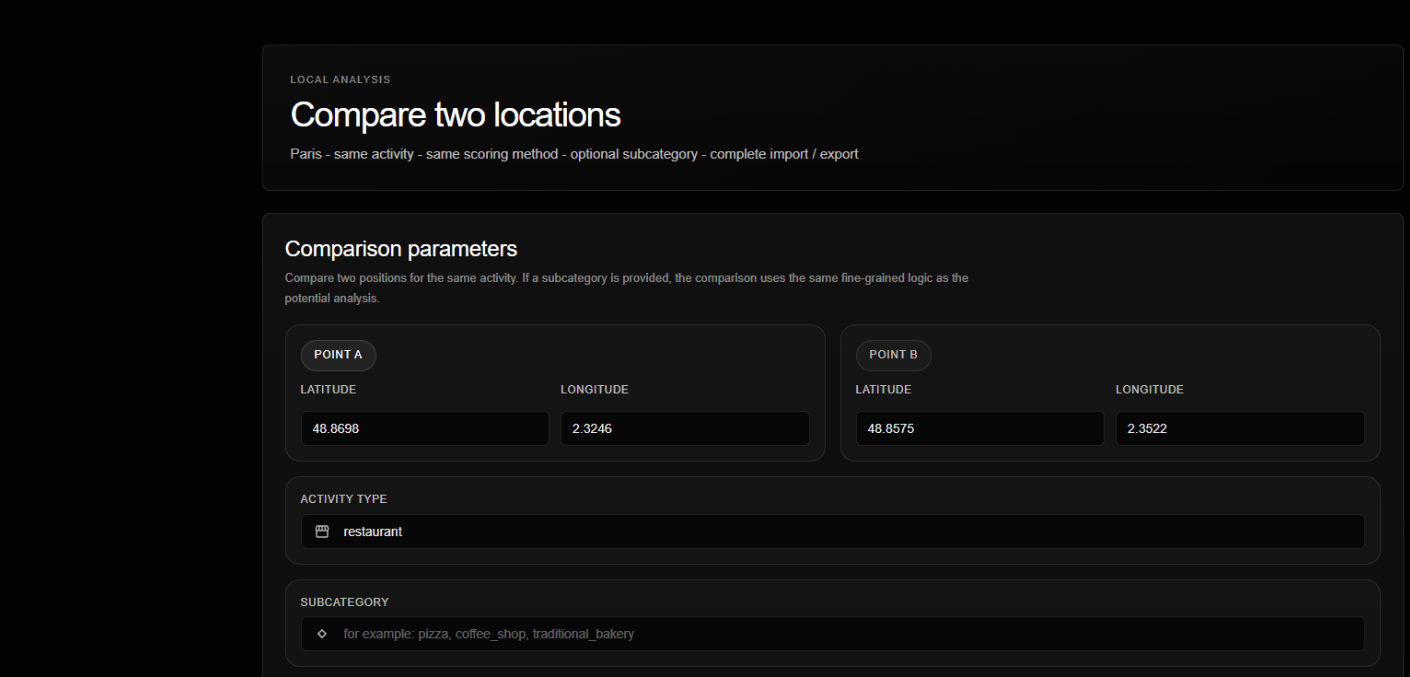
Location comparison evaluates two points with the same scoring method and activity profile. It is designed for shortlists, lease decisions and final trade-offs between two viable addresses.

Use it to compare scores, pillar gaps, nearby competitors and the relative strengths of point A versus point B.
Business calculators screenshot
Tool 06

Business calculators

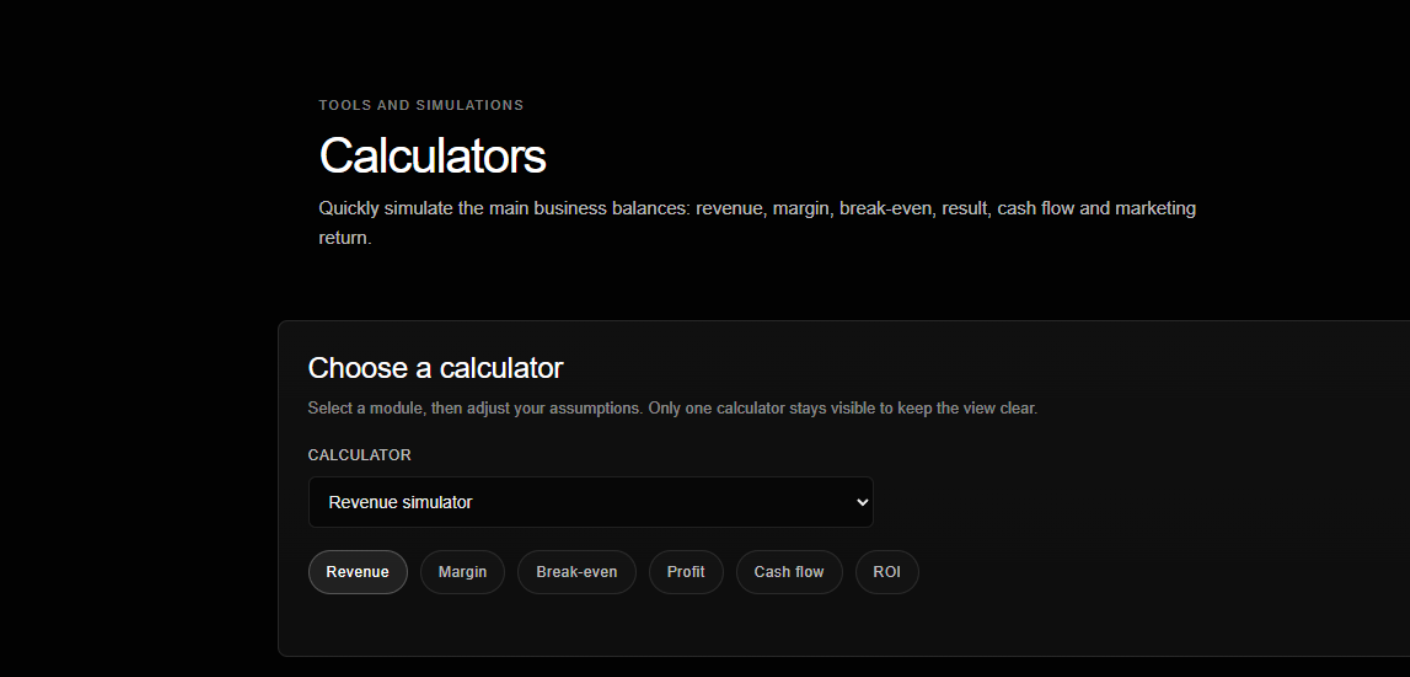
The calculators turn location decisions into operational assumptions. They help estimate revenue, margin, break-even, profit, cash flow and marketing return from simple business inputs.

Use them after identifying a promising location to test whether the commercial assumptions are financially coherent.
Saved reports screenshot
Workspace

Saved reports

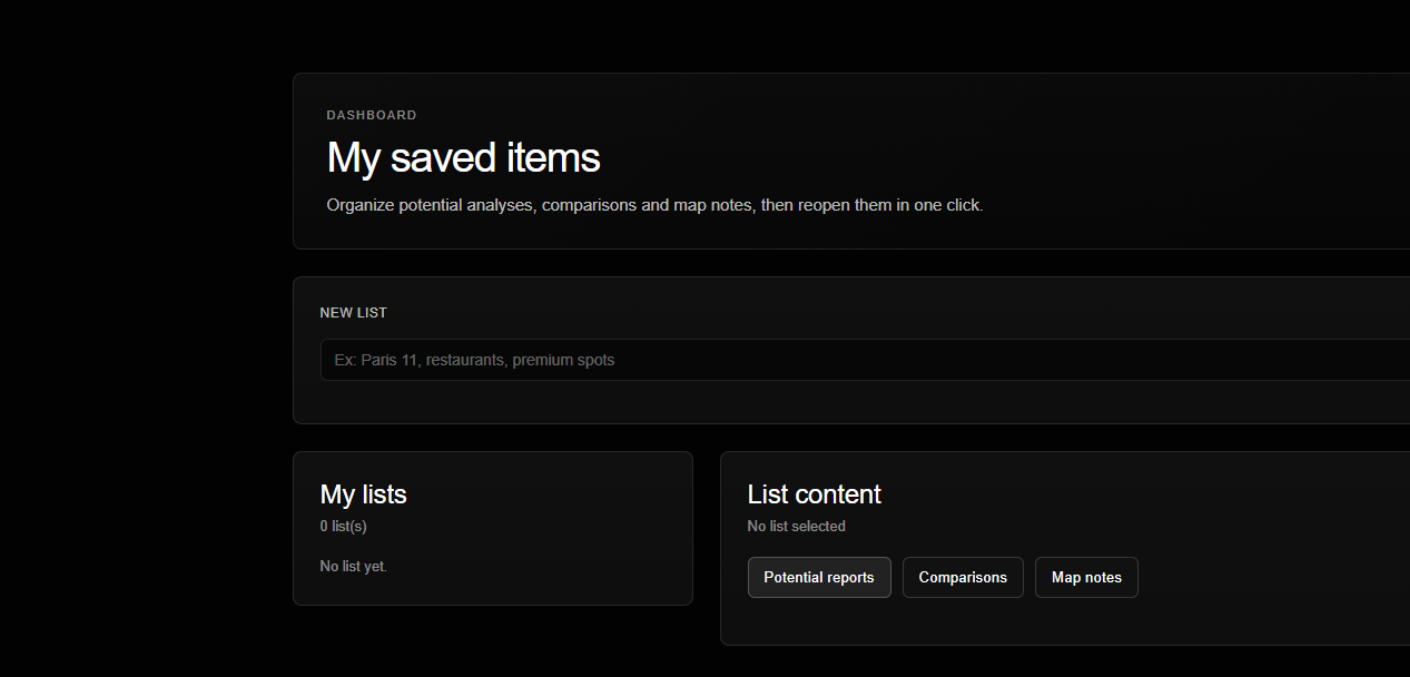
Saved reports turn individual analyses into an organized workspace. Reports, comparisons and map notes can be grouped by list so research for a city, district or project remains easy to reopen.

Use lists to group candidate locations, potential reports and comparisons throughout the decision process.